Local authority elections in Sunderland, England
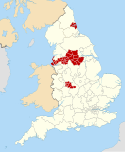
Sunderland City Council elections are generally held three years out of every four, with a third of the council being elected each time. Sunderland City Council is the local authority for the metropolitan borough of the City of Sunderland in Tyne and Wear, England. Since the last boundary changes in 2004, 75 councillors have been elected from 25 wards.[1]
Council composition
Whilst under Labour control solidly since 1973, the political composition of Sunderland City Council has fluctuated over the years as the Conservatives, SDP-Liberal Alliance, and Independents gained seats from the Labour Party. Until 2019, only Labour, Conservatives, Liberal Democrats and Independents (including Independent Labour) had ever won seats on Sunderland City Council.[2] When UKIP and Green Party councillors were elected in 2019, Sunderland became one of the few British councils with all five parties represented. The table below gives an impression of the council's composition based on local election results.[3]
| Election | Conservative | Labour | Liberal Democrat[4] | Independent | UKIP | Green | Reform UK | Total |
| | | | | | | |
| 1973 | 21 | 56 | 0 | 1 | 0 | 0 | 0 | 78 |
| 1975 | 23 | 52 | 1 | 2 | 0 | 0 | 0 | 78 |
| 1976 | 26 | 49 | 1 | 2 | 0 | 0 | 0 | 78 |
| 1978 | 27 | 49 | 1 | 1 | 0 | 0 | 0 | 78 |
| 1979 | 24 | 53 | 0 | 1 | 0 | 0 | 0 | 78 |
| 1980 | 18 | 58 | 1 | 1 | 0 | 0 | 0 | 78 |
| 1982 | 15 | 49 | 8 | 3 | 0 | 0 | 0 | 75 |
| 1983 | 14 | 52 | 7 | 2 | 0 | 0 | 0 | 75 |
| 1984 | 13 | 53 | 7 | 2 | 0 | 0 | 0 | 75 |
| 1986 | 11 | 59 | 5 | 0 | 0 | 0 | 0 | 75 |
| 1987 | 10 | 61 | 4 | 0 | 0 | 0 | 0 | 75 |
| 1988 | 9 | 63 | 3 | 0 | 0 | 0 | 0 | 75 |
| 1990 | 8 | 64 | 3 | 0 | 0 | 0 | 0 | 75 |
| 1991 | 8 | 64 | 3 | 0 | 0 | 0 | 0 | 75 |
| 1992 | 8 | 64 | 3 | 0 | 0 | 0 | 0 | 75 |
| 1994 | 8 | 64 | 3 | 0 | 0 | 0 | 0 | 75 |
| 1995 | 5 | 67 | 3 | 0 | 0 | 0 | 0 | 75 |
| 1996 | 4 | 68 | 3 | 0 | 0 | 0 | 0 | 75 |
| 1998 | 4 | 68 | 3 | 0 | 0 | 0 | 0 | 75 |
| 1999 | 8 | 64 | 3 | 0 | 0 | 0 | 0 | 75 |
| 2000 | 10 | 62 | 3 | 0 | 0 | 0 | 0 | 75 |
| 2002 | 11 | 62 | 2 | 0 | 0 | 0 | 0 | 75 |
| 2003 | 9 | 63 | 1 | 2 | 0 | 0 | 0 | 75 |
| 2004 | 12 | 61 | 2 | 0 | 0 | 0 | 0 | 75 |
| 2006 | 13 | 59 | 2 | 1 | 0 | 0 | 0 | 75 |
| 2007 | 17 | 53 | 1 | 4 | 0 | 0 | 0 | 75 |
| 2008 | 22 | 48 | 1 | 4 | 0 | 0 | 0 | 75 |
| 2010 | 18 | 52 | 1 | 4 | 0 | 0 | 0 | 75 |
| 2011 | 14 | 56 | 1 | 4 | 0 | 0 | 0 | 75 |
| 2012 | 8 | 64 | 0 | 3 | 0 | 0 | 0 | 75 |
| 2014 | 8 | 63 | 0 | 4 | 0 | 0 | 0 | 75 |
| 2015 | 6 | 66 | 0 | 3 | 0 | 0 | 0 | 75 |
| 2016 | 6 | 67 | 1 | 1 | 0 | 0 | 0 | 75 |
| 2018 | 8 | 61 | 6 | 0 | 0 | 0 | 0 | 75 |
| 2019 | 12 | 51 | 8 | 0 | 3 | 1 | 0 | 75 |
| 2021 | 18 | 42 | 12 | 0 | 3 | 0 | 0 | 75 |
| 2022 | 18 | 41 | 14 | 1 | 0 | 0 | 0 | 75 |
| 2023 | 13 | 45 | 15 | 0 | 0 | 0 | 1 | 75 |
| | | | | | | | | |
Council elections
Sunderland's Council area comprises 25 wards, each electing three councillors. Elections are held in thirds, in three years out of every four. Between 1974 and 1986, elections were held in every fourth year to Tyne and Wear County Council, until the County Council was abolished. In 1982 and 2004, all seats on Sunderland Council were up for election following boundary changes.[5]
Elections under 1973-1980 boundaries
Elections under 1982-2003 boundaries
Elections under 2004 boundaries
Election results maps
-
2004 results map
-
2006 results map
-
2007 results map
-
2008 results map
-
2010 results map
-
2011 results map
-
2012 results map
-
2014 results map
-
2015 results map
-
2016 results map
-
2018 results map
-
2019 results map
-
2021 results map
-
2022 results map
-
2023 results map
By-election results
1994-1998
South Hylton By-Election 18 September 1997 | Party | Candidate | Votes | % | ±% |
| | Labour | | 636 | 71.1 | -10.3 |
| | Conservative | | 178 | 19.9 | +1.3 |
| | Liberal Democrats | | 80 | 9.0 | +9.0 |
| Majority | 458 | 51.2 | |
| Turnout | 894 | 11.4 | |
| | Labour hold | Swing | | |
1998-2002
Colliery By-Election 23 July 1998 | Party | Candidate | Votes | % | ±% |
| | Labour | | 646 | 46.7 | -18.7 |
| | Conservative | | 394 | 28.5 | +9.9 |
| | Liberal Democrats | | 343 | 24.8 | +8.9 |
| Majority | 252 | 18.2 | |
| Turnout | 1,383 | 18.0 | |
| | Labour hold | Swing | | |
Town End Farm By-Election 6 July 2000 | Party | Candidate | Votes | % | ±% |
| | Labour | | 509 | 63.4 | |
| | Conservative | | 155 | 19.3 | |
| | Liberal Democrats | | 139 | 17.3 | |
| Majority | 354 | 44.1 | |
| Turnout | 803 | 11.8 | |
| | Labour hold | Swing | | |
Eppleton By-Election 7 June 2001 | Party | Candidate | Votes | % | ±% |
| | Labour | | 3,074 | 65.9 | +2.2 |
| | Conservative | | 860 | 18.4 | -17.8 |
| | Liberal Democrats | | 731 | 15.7 | +15.7 |
| Majority | 2,214 | 47.5 | |
| Turnout | 4,665 | | |
| | Labour hold | Swing | | |
2004-2006
Barnes by-election, 24 November 2005 | Party | Candidate | Votes | % | ±% |
| | Conservative | Anthony Morrissey | 1,139 | 50.8 |  15.8 15.8 |
| | Liberal Democrats | Peter Taylor | 547 | 24.4 |  4.7 4.7 |
| | Labour | Ian Galbraith | 489 | 21.8 | 4.5 |
| | BNP | Ian Leadbitter | 67 | 3.0 | 6.6 |
| Majority | 592 | 26.4 | |
| Turnout | 2,242 | 25.5 | 23 |
| | Conservative hold | Swing | 10.3 | |
Millfield by-election, 23 March 2006[7] | Party | Candidate | Votes | % | ±% |
| | Liberal Democrats | Paul Dixon | 566 | 43.5 | 10.2 |
| | Labour | Shirley Waldron | 397 | 30.5 | 1.1 |
| | Conservative | Leslie Dobson | 260 | 20.0 | 1.6 |
| | BNP | James Davison | 79 | 6.0 | 7.4 |
| Majority | 169 | 13.0 | |
| Turnout | 1,302 | 18.2 | 17.7 |
| | Liberal Democrats hold | Swing | 5.7 | |
2006-2010
Washington East by-election, 27 September 2007[8] | Party | Candidate | Votes | % | ±% |
| | Conservative | Angela Cuthbert | 1,196 | 49.9 | 9.8 |
| | Labour | Dianne Snowdon | 994 | 41.5 | 2.2 |
| | Liberal Democrats | David Snowball | 206 | 8.6 | 5.6 |
| Majority | 202 | 8.4 | |
| Turnout | 2,396 | 27.6 | 8.3 |
| | Conservative gain from Labour | Swing | 6 | |
2010-2014
Houghton by-election, 2 May 2013 | Party | Candidate | Votes | % | ±% |
| | Labour | Gemma Taylor | 1,418 | 47.1 | 1.3 |
| | Independent | John Ellis | 1,124 | 37.3 | 37.3 |
| | UKIP | Edward Coleman-Hughes | 302 | 10 | |
| | Conservative | George Brown | 111 | 3.7 | |
| | Liberal Democrats | Sue Sterling | 55 | 1.8 | 0.5 |
| Majority | 294 | 9.8 | |
| Turnout | 3,010 | 33.3 | 2.5 |
| | Labour hold | Swing | 19.3 | |
2014-2018
St Anne's by-election, 27 March 2014 | Party | Candidate | Votes | % | ±% |
| | Labour | Jacqui Gallagher | 945 | 48.1 | 24 |
| | UKIP | Aileen Casey | 555 | 28.2 | 28.2 |
| | Conservative | Tony Morrissey | 345 | 17.6 | 3.6 |
| | Green | Emily Blyth | 120 | 6.1 | 5 |
| Majority | 390 | 19.8 | |
| Turnout | 1,965 | 23.2 | 4.8 |
| | Labour hold | Swing | 26.1 | |
Washington East by-election, 11 December 2014 | Party | Candidate | Votes | % | ±% |
| | Labour | Tony Taylor | 775 | 38.3 | 3 |
| | Conservative | Hilary Johnson | 595 | 29.4 | 4.1 |
| | UKIP | Alistair Baxter | 506 | 25 | 1.1 |
| | Green | Tony Murphy | 93 | 4.6 | |
| | Liberal Democrats | Stephen O'Brien | 52 | 2.6 | 2.2 |
| Majority | 180 | 8.9 | |
| Turnout | 2,021 | 23.4 | 10.9 |
| | Labour hold | Swing | 3.6 | |
Sandhill by-election, 12 January 2017 | Party | Candidate | Votes | % | ±% |
| | Liberal Democrats | Stephen O'Brien | 824 | 45.0 | 41.5 |
| | Labour | Gary Waller | 458 | 25.0 | 29.9 |
| | UKIP | Bryan Foster | 343 | 18.7 | 7.2 |
| | Conservative | Gavin Wilson | 184 | 10.0 | 5.7 |
| | Green | Helmut Izaks | 23 | 1.3 | |
| Majority | 366 | 20.0 | |
| Turnout | 1,832 | 23.8 | 4.8 |
| | Liberal Democrats gain from Labour | Swing | 35.7 | |
Pallion by-election, 1 February 2018 | Party | Candidate | Votes | % | ±% |
| | Liberal Democrats | Martin Haswell | 1,251 | 53.8 | 49.5 |
| | Labour | Gordon Chalk | 807 | 31.7 | 25.9 |
| | Conservative | Grant Shearer | 126 | 5.4 | 4.2 |
| | UKIP | Steven Bewick | 97 | 4.2 | 24.7 |
| | Green | Craig Hardy | 39 | 1.7 | 1.8 |
| Majority | 444 | 19.1 | |
| Turnout | 2,324 | 31.7 | 2.7 |
| | Liberal Democrats gain from Labour | Swing | 37.7 | |
2018-2022
Hetton by-election, 30 September 2021 | Party | Candidate | Votes | % | ±% |
| | Labour | Iain Scott | 661 | 31.6 | 1.7 |
| | Liberal Democrats | John Lennox | 634 | 30.3 | 30.3 |
| | Independent | David Geddis | 386 | 18.5 | 3.1 |
| | Conservative | Adelle Burnicle | 303 | 14.5 | 8.8 |
| | Independent | Maurice Allen | 67 | 3.2 | 3.2 |
| | Green | Justine Merton-Scott | 41 | 2 | 1.8 |
| Majority | 27 | 1.3 | 3.3 |
| Turnout | 2,092 | 22.5 | 10.3 |
| | Labour hold | Swing | 16 | |
Redhill by-election, 3 March 2022[9] | Party | Candidate | Votes | % | ±% |
| | Labour | John Usher | 709 | 46.9 | 9.3 |
| | Liberal Democrats | Steven Donkin | 386 | 25.5 | 25.5 |
| | Conservative | Sue Leishman | 296 | 19.6 | 5.5 |
| | UKIP | Ian Lines | 85 | 5.6 | 35.4 |
| | Green | Helmut Izaks | 35 | 2.3 | 5.0 |
| Majority | 323 | 21.4 | |
| Turnout | 1,511 | | |
| | Labour gain from UKIP | Swing | | |
At the time of resignation, incumbent Keith Jenkins was an independent.[10]
References
- ^ "Information available about your Local Area". Sunderland City Council. Retrieved 21 December 2010.
- ^ "Tyne and Wear: Ward Voting Summaries, 1973-2015". Tyne and Wear Elects. Retrieved 19 February 2018.
- ^ Incorporating local by-election results from 2000.
- ^ Liberal prior to 1981, SDP-Liberal Alliance from 1981 to 1988.
- ^ "Tyne and Wear: Ward Voting Summaries 1973-2015". Tyne and Wear Elects. Retrieved 19 February 2018.
- ^ "Sunderland council". BBC News Online. Retrieved 21 December 2010.
- ^ "Lib-Dems retain second seat in city". Sunderland Echo. 24 March 2006. Retrieved 21 December 2010.
- ^ "Declaration of Result of Poll". Sunderland City Council. Archived from the original on 7 August 2011. Retrieved 21 December 2010.
- ^ "Local Elections Archive Project — Redhill Ward". www.andrewteale.me.uk. Retrieved 17 April 2022.
- ^ Clark, Kevin (19 January 2022). "By-election looms after resignation of former UKIP city councillor Keith Jenkins". Sunderland Echo. Retrieved 17 April 2022.
External links
|
|---|
| Districts | | |
|---|
| Councils | |
|---|
| Local elections | |
|---|
 2004 results map
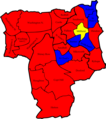 2006 results map
 2007 results map
 2008 results map
 2010 results map
 2011 results map
 2012 results map
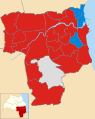 2014 results map
 2015 results map
 2016 results map
 2018 results map
 2019 results map
 2021 results map
 2022 results map
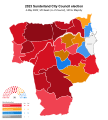 2023 results map


 15.8
15.8  4.7
4.7  Council elections in Tyne and Wear